


So this is my first post here.
I've always been interested in demographics, development patterns and such, and started a blog to post stats I've gathered into maps/tables/graphs. I'm from the Toronto area so several of my posts are about it, but I've made several posts recently that are about Detroit and thought I'd share content from them here.
First post with Detroit was showing how the population of different parts of various cities changed between 1950 and 2010 [[% change).
For Detroit I also included Hamtramck and Highland Park.
So the area in the NW corner of Detroit has more people in it than it did in 1950. It did lose population since it's peak, but the peak was after 1950 [[1960 or 1970 I think). There's a few others that peaked in 1960 too, but lost more population since 1960 than they gained 1950-1960.
You can see how Detroit compares to Pittsburgh, St Louis, Buffalo and Cleveland here
http://swontariourbanist.blogspot.ca...lt-trends.html
And Chicago, Philadelphia, Baltimore, Cincinnati, New Orleans and Montreal here
http://swontariourbanist.blogspot.ca...mparisons.html
Houston, Atlanta, Dallas, Nashville, Miami
http://swontariourbanist.blogspot.ca...opulation.html
And Ontario cities [[1956-2011) - Toronto, Hamilton, Ottawa, London, Windsor and Kitchener-Waterloo
http://swontariourbanist.blogspot.ca...1956-2011.html
So all these cities [[except Miami and sort of Toronto) lost population in their cores, sometimes mostly due to household size changes, sometimes also due to significant abandonment, although most didn't lose as much as Detroit.
Results 1 to 25 of 27
Thread: Metro Detroit demographics
-
February-09-15, 12:00 AM #1
 DetroitYES Member
- Join Date
- Feb 2015
- Posts
- 17
 Metro Detroit demographics
-
February-09-15, 12:07 AM #2
DetroitYES Member
- Join Date
- Feb 2015
- Posts
- 17
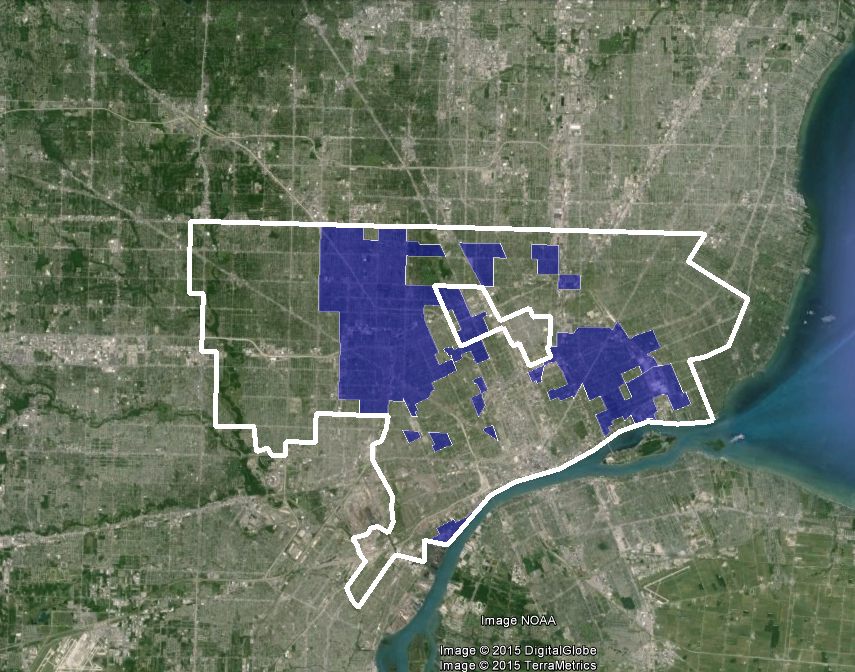
After that I mostly focused on changes in racial composition, places where the minority population share increased by 20 percentage points between 2000 and 2010. It's colour coded by the minority group that increased the most [[in terms of percentage points).
Blue = black
Yellow = Hispanic
Red = Asian
Green = 2 or more
Probably this doesn't surprise most here.

Note that most of Detroit was already under 20% white in 2000 so in those cases the minority share could not have increased by more than 20 percentage points. That's why the highlighted areas are mostly the outermost parts of Detroit and inner suburbs.
I've compared Detroit to Houston where neighbourhoods changing by 20 percentage points in terms of minority/non-minority are actually quite a bit more common than in Detroit, probably at least partly because of a ton of minorities moving to the Houston MSA.
Maps
http://swontariourbanist.blogspot.ca...ialethnic.html
Stats
http://swontariourbanist.blogspot.ca...ethnic_22.htmlLast edited by Memph; February-09-15 at 12:21 AM.
-
February-09-15, 12:19 AM #3
DetroitYES Member
- Join Date
- Feb 2015
- Posts
- 17
Comparing the above to previous decades, these kinds of fast changes in racial make-up are not as prevalent today.
90s

80s

70s

60s
There's more detailed stats here
http://swontariourbanist.blogspot.ca...n-detroit.html
Also if you look on socialexplorer, the changes in some cases in the 60s and 70s were like 100% white and then 80% black a decade later [[also shown in link above). That kind of very fast change at the census tract level doesn't happen anymore, the rate of change nowadays is at most half that.
That kind of rate of white flight in the 60s/70s was not unique to Detroit though. It seems like it was even worse and more common in Chicago's west and south sides, and parts of Dallas, Atlanta, Cleveland, St Louis and LA changed pretty fast too. I might go into more details on that when I have time.
-
February-09-15, 12:57 AM #4
DetroitYES Member
- Join Date
- Sep 2011
- Posts
- 875
Interesting. On the first map, the reason why the northwest corner is larger than it was in 1950 was that it was basically the last spot to be developed. It's also why the population loss looks comparatively well in the two tracks to the south [[i.e. most of the areas west of the Southfield Freeway).
What the first map really displays is the emptying out of the inner-city, though. Downtown, Midtown, New Center, Corktown, the near east side, etc...are literal former shells of themselves in most respects. The tract that loses the most is outside of downtown, but it's also obvious why it's so depopulated. Delray was probably one of the first areas in the city to loses significant population [[wouldn't be surprised to find it having began its loss during the 30's, quite honestly), and it was because of major land-use changes with residential neighborhoods being replaced by heavy industry.
-
February-09-15, 10:27 AM #5
DetroitYES Member
- Join Date
- Mar 2009
- Posts
- 5,457
The green shape covers Brightmoor. Frankly, I'm a little surprised that it's only a 23% decline because Brightmoor is virtually empty now, and I thought Brightmoor had a pretty large population mid-century. That would suggest that the other neighborhoods around there have kept a stable population relative to the 1950 population, even despite declining household sizes... Originally Posted by Dexlin

-
February-09-15, 04:11 PM #6
DetroitYES Member
- Join Date
- Aug 2010
- Posts
- 333
My family lived in that area marked +21% from 1954 to 2008. Back in the 1960s, there still empty lots being filled with new homes throughout that region. The area with the most rot and removal of homes is the square bounded by Lahser, Seven Mile, Evergreen and Six Mile. The most glaring example being Clarita heading east from Lahser.
-
February-09-15, 04:34 PM #7
DetroitYES Member
- Join Date
- Feb 2015
- Posts
- 17
Yeah, the NW corner [[pink) is north of McNichols/6 Mile, west of Southfield Freeway Originally Posted by Dexlin
It's population was
1940: 11,314
1950: 32,486
1960: 56,630
1970: 56,850
1980: 52,258
1990: 51,364
2000: 48,841
2010: 38,443
The area in green includes Brightmoor but also Rosedale Park and southern part of Grandmont. The census tract boundaries between those two neighbourhoods changed so I had to include them together.
1940: 39,108
1950: 55,469
1960: 70,062
1970: 71,409
1980: 64,676
1990: 62,314
2000: 56,537
2010: 42,214
Yellow area [[Warrendale/Grandale area)
1940: 18,735
1950: 73,119
1960: 92,497
1970: 86,014
1980: 72,766
1990: 69,122
2000: 66,323
2010: 52,818
So population loss relative to peak
Warrendale-Grandale: -42.9% [[1960)
Brightmoor-Rosedale Park: -40.9% [[1970)
Far NW/Old Redford: -32.4% [[1970)
I suspect many of the outer neighbourhoods in the NE of Detroit would be similar, i.e. with a population peak in 1960 [[or even 1970?).
As for Delray, there's no data for 1930, but it did start losing population in the 1940s, and then population loss increased in the following decades.
1940: 25,785
1950: 22,882 [[-11.3%)
1960: 17,342 [[-24.2%)
1970: 12,560 [[-27.6%)
1980: 7,096 [[-43.5%)
1990: 5,588 [[-22.3%)
2000: 4,164 [[-25.5%)
2010: 2,783 [[-33.2%)Last edited by Memph; February-09-15 at 04:47 PM.
-
February-09-15, 04:51 PM #8
DetroitYES Member
- Join Date
- Feb 2015
- Posts
- 17
Yeah, that area is down 39.3% since its 1960 population peak and 32.5% down from 1950. Originally Posted by Pickford-Bentler
-
February-09-15, 05:11 PM #9
Administrator
- Join Date
- Jan 2009
- Posts
- 101
Great opening posts with very interesting data Memph! Welcome to DetroitYES.
It gives a very descriptive visualization of shifting cultures. Do you do anything on emergence and movements of Arabic and Jewish Detroit?
-
February-10-15, 05:45 PM #10
DetroitYES Member
- Join Date
- Apr 2009
- Posts
- 1,028
Nice data and presentation, Memph. I'm curious about what software you used to make the maps, define the areas, color them and post the numbers.
-
February-16-15, 12:06 AM #11
DetroitYES Member
- Join Date
- Feb 2015
- Posts
- 17
I just use Google Earth, socialexplorer and paint.net so pretty ghetto. Originally Posted by Det_ard

Not yet, I don't have the professional version of socialexplorer which would be needed for religion data. Socialexplorer [[professional) seems to have data for Judaism from 1980 and Islam from 2000. I'm not sure if there's anywhere like socialexplorer that has conveniently viewable data on Arabs [[rather than Muslims). Originally Posted by admin
-
February-16-15, 12:09 AM #12
DetroitYES Member
- Join Date
- Feb 2015
- Posts
- 17
Here's some segregation graphs. I've seen attempts to boil down segregation to a single number, as well as attempts to map it, but not sure if anyone's tried graphing it.
My first post was comparing Detroit and Atlanta.
http://swontariourbanist.blogspot.ca...gregation.html
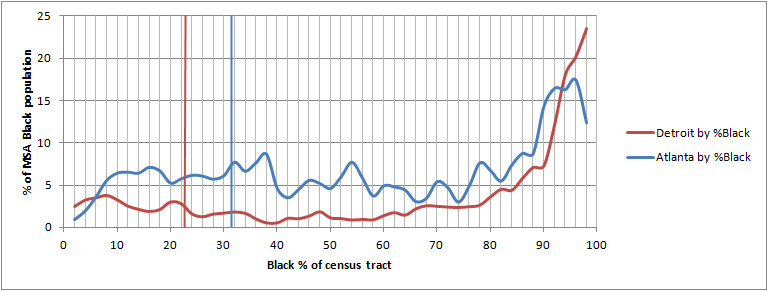
So this shows the % of MSA blacks by black % +/- 2% at the census tract level.
As an example of how this works, 23.5% of Metro Detroit blacks live in census tracts that are 96-100% black.About 8.5% of Metro Atlanta blacks live in census tracts that are 36-40% black.
Vertical lines are the MSA averages.

-
February-16-15, 12:12 AM #13
DetroitYES Member
- Join Date
- Apr 2009
- Posts
- 132
Great information, thanks for posting this.
-
February-16-15, 12:15 AM #14
DetroitYES Member
- Join Date
- Feb 2015
- Posts
- 17
The most recent post compared the Detroit of 2010 to the Detroit of 1960.
http://swontariourbanist.blogspot.ca...etroit-in.html


So blacks are a bit more likely to live in overwhelming black neighbourhoods, but also more likely to live in mostly white neighbourhoods.
Just about all whites still live in predominantly white census tracts, although they're now more likely to have a moderate minority of blacks and Asians [[and Hispanics but those weren't counted as separate here).


-
February-16-15, 08:51 AM #15
DetroitYES Member
- Join Date
- Mar 2009
- Posts
- 6,547
Meanwhile, Black flight to the suburbs continues...
In Macomb County:
Metro-Detroit according to 2013 Census.gov by block tract, In the City of Warren in the some parts of South Warren Area at the Van Dyke to E. 9 Mile Rd. to E. 8 Mile Rd. to Gratiot Ave. area at the Eastpointe border a new black community has surfaced. from 45 to 51 percent.
Some neighborhoods in Warren experience a sudden increase of black families from 10 to 30 percent.
In Clinton TWP.
A steady increase of low-income black families are living on E. 15 Mile Rd. between Harper Rd. and Gratiot Ave.
In Eastpointe:
The area from Toepfer St. from Gratiot Ave. to to Beaconsfield St. to E. 8 Mile Rd. has 48 to 61 percent black.
Some areas in Eastpointe had experienced a sudden increase of blacks from 30- 40 percent.
In Wayne County:
In Harper Woods had experienced a sudden influx of black families from 45 to 50 percent from Kingsville St .to Vernier Ave. to E. 8 Mile Rd. from Kelly Rd. to Mack Ave. Black families will be the dominate group in Harper Woods in 25 years.
In Redford TWP:
A fast growing influx a black families are occupying in the areas in Parkway Heights sub-division from Joy Rd. to the rail road tracks of Castle Rouge area in Detroit up to 70 percent. Fifty percent of black families are living in Brightmoor Heights sub-division from I-96 Schoolcraft FWY. to Five Mile Rd. from Beech Daly Rd. to Telegraph Ave.
Black families are also migrating from Detroit and other parts to other Redford TWP. sub-divisions south of I-96 Schoolcraft FWY. near Thurston High School Area from 38 to 48 percent.
In Westland:
Low-income and few middle income black families are residing at Middlebelt Rd. from Annapolis St. from Merriman Rd. to Inkster Rd. even to the border of Inkster. A sudden explosion of black single middle class folks are moving in most Westland Apartment complexes along W. Warren Ave. from Merriman to Middlebelt Rd. near the lower Rouge River areas. A new dominate single black middle class famlies and single middle class blacks are migrating to areas of W. Warren Ave., Newburgh Rd., Joy Rd. and Wayne Rd. areas up to 48 percent.
Fourty-Five percent of single middle income blacks are living along Hunter Rd. to W. Warren Rd., from Wayne Rd., to Central City Parkway Ave.
In Romulus:
up to 60 to 80 percent of middle to low income blacks [[ mostly from Inkster ) are in the the areas on Van Born Rd. from Hannan Rd. to Merriman Rd. New black communities are forming from I-94 FWY to Pennsylvania Rd. As far as I- 275 FWY. and near Downtown Romulus area and around the Detroit-Metro Airport area.
In Taylor:
Fifty to Sixty percent of mostly low-income and single black families are migrating to the Ponds Apt complexes from Eureka Rd. to Pennsylania Rd. from Beech Daly Rd. to Inkster Rd. near the border of Romulus. A new black community has formed.
-
February-16-15, 02:47 PM #16
DetroitYES Member
- Join Date
- Feb 2015
- Posts
- 17
Ponds Apts was already over 75% black in 2000 from the looks of it though [[and about 90% now in 2010).
http://www.urbanresearchmaps.org/com...uralitymap.htm
And btw I wouldn't call black flight a new phenomenon, I think it's probably been happening in Detroit since the 60s or 70s [[or even 50s?) it's just that back then leaving the ghetto for greener pastures meant crossing 5 mile or 6 mile or 7 mile, and now it means crossing 8 mile.
-
August-03-15, 09:59 PM #17
DetroitYES Member
- Join Date
- Feb 2015
- Posts
- 17
A little preview of something I'm working on - population change by decade from 1940 to 2010.
1940s

Legend is the same as for the NYtimes maps
http://projects.nytimes.com/census/2010/map
Dark Blue = 20%+ increase
Med Blue = 10-20% increase
Light Blue = 0-10% increase
Light Tan = 0-10% decrease
Med Tan = 10-20% decrease
Dark Tan = 20%+ decreaseLast edited by Memph; August-03-15 at 10:03 PM.
-
August-09-15, 11:58 PM #18
DetroitYES Member
- Join Date
- Feb 2015
- Posts
- 17
Just finished up the new blog post:
http://swontariourbanist.blogspot.ca...etroit-by.html
1940s

1950s

1960s

1970s

1980s

1990s

2000s

Last edited by Memph; August-10-15 at 12:01 AM.
-
August-10-15, 08:14 AM #19
DetroitYES Member
- Join Date
- Mar 2009
- Posts
- 4,317
That's amazing. Scrolling through those maps was like watching my whole lifetime roll by in the D. Heartbreaking to hopeful.
-
August-10-15, 08:26 AM #20
DetroitYES
- Join Date
- Feb 2009
- Posts
- 6,778
Nice work Memph. The 2000 maps shows the influence of immigrant populations, Bengali/Yememi around Hamtramck and Mexican/Latino in Southwest.
-
August-10-15, 10:12 AM #21
DetroitYES Member
- Join Date
- Jul 2013
- Posts
- 593
That was fascinating. Thank you very much. On the charts where the color [[blue, yellow, red) are overlayed on the google earth photo of Detroit, if you scroll through them quickly, you can see a wave of neighborhoods where there was a 20%+ increase in black population, radiating from the center of Detroit outward.
Would you guess that was the result of a) black populations moving outward from the city center, or b) non-black populations leaving those areas, therefore increasing the black %? Can you tell from the data?
I would love to see current demographic data [[median average income, population, etc.) from the downtown area as of today.
-
August-10-15, 11:00 AM #22
DetroitYES Member
- Join Date
- Apr 2009
- Posts
- 2,773
Did you look at the separate population change by decades charts? As the author indicates It is pretty clear that you have two separate things happening. First, you have black families moving into census tracts as whites leave, raising the percentage of blacks, and during that stage if anything the population of those tracts increases. But those people come from more central tracts, which show drops in population, but that doesn't affect the racial percentages a lot in those tracts which are already overwhelmingly black. As this happens several times you see a "wave". After the waves have passed over the entire city the total effect is the substantial overall population loss and low percentage of whites that you see in the city now. Originally Posted by BankruptcyGuy
As you can also see, starting in the 90's there began to be a repopulation of greater downtown, but although the percentages are substantial, the starting populations in those areas were so small that it wasn't and isn't close to offsetting the losses in the rest of the city. But as the population of greater downtown and its outskirts becomes a bigger portion of the total population of the city, its impact should become more significant.
-
August-10-15, 12:45 PM #23
DetroitYES Member
- Join Date
- Mar 2009
- Posts
- 559
Originally Posted by BankruptcyGuy
Have you seen 7.2 SQ MI, a Report Greater Downtown Detroit, second edition? Some of the data seems to be as old as 2011 and some as recent as 2014.
http://detroitsevenpointtwo.com/reso...INAL_LoRes.pdf
-
August-10-15, 10:47 PM #24
DetroitYES Member
- Join Date
- Feb 2015
- Posts
- 17
Here's the maps showing which neighbourhoods experienced rapid transitions from white to black in the 40s and 50s.
1940s

1950s

Also have some more detailed stats here:
http://swontariourbanist.blogspot.ca...hanges-in.html
-
August-11-15, 08:10 AM #25
DetroitYES Member
- Join Date
- Jul 2013
- Posts
- 593
I did. Everything they have is a few years old. Originally Posted by Neilr
Very much looking forward to a data update. No one will be able to argue with the resurgence of downtown when they see the numbers.


 Reply With Quote
 Posting Permissions
Instagram
DetroitYES navigation
DetroitYES Management
© AtDetroit LLC 2000 - 2024 unless otherwise specified. Please notify us of uncited proprietary content.
Welcome to DetroitYES! Kindly Consider Turning Off Your Ad BlockingX
DetroitYES! is a free service that relies on revenue from ad display [regrettably] and donations. We notice that you are using an ad-blocking program that prevents us from earning revenue during your visit.
Ads are REMOVED for Members who donate to DetroitYES! [You must be logged in for ads to disappear]
Ads are REMOVED for Members who donate to DetroitYES! [You must be logged in for ads to disappear]
DONATE HERE »
And have Ads removed.
And have Ads removed.
Bookmarks